/Conversion optimisation
Shopify conversion rate statistics 2026: the benchmarks that actually matter
August 12, 2026 · WOCX
Most “Shopify statistics” articles are a wall of numbers with no source and no meaning. You cannot tell which figure came from an official filing and which someone invented for a listicle, and none of them tell you what to do with the number once you have read it. This page is the opposite. Every figure below is attributed, the strong sources are separated from the soft ones, and each block ends with what the number actually means for your store.
One honesty note before the numbers, because it is the whole point. Two kinds of statistic get mixed together in these roundups. The first comes from a primary source you can verify: Shopify’s own financial filings, or the Baymard Institute’s cart-abandonment research. Those are solid. The second is an industry estimate, usually a conversion benchmark from an analytics provider, and those vary a lot from source to source because everyone measures a slightly different set of stores. We label which is which throughout. Treat the estimates as directional, not gospel.
How big Shopify actually is
Start with the numbers that are genuinely reliable, because they come straight from Shopify’s audited financial statements rather than a blog.
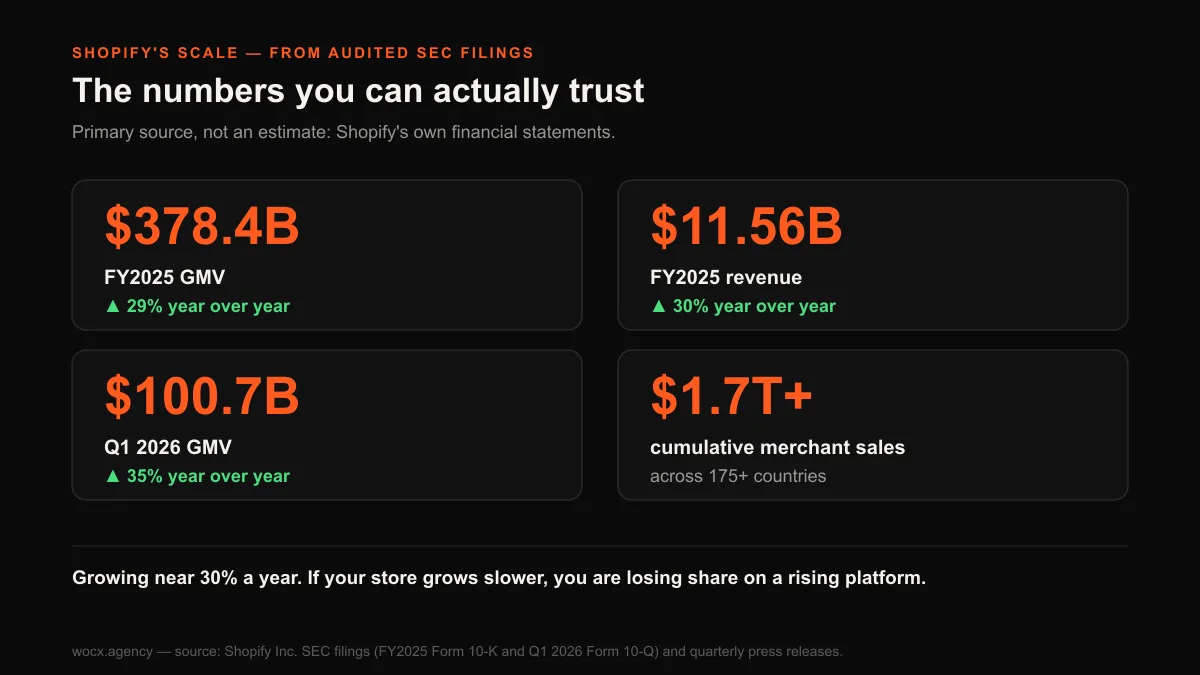
In its 2025 financial year Shopify facilitated $378.4 billion in gross merchandise volume (GMV), up 29% year over year, and generated $11.56 billion in revenue, up 30% from $8.88 billion the year before. Momentum carried into 2026: in the first quarter alone Shopify reported $100.7 billion in GMV, up 35% on the same quarter a year earlier. These figures are from Shopify’s SEC filings and quarterly press releases, which is about as authoritative as a number gets.
Cumulatively, merchants have now sold more than $1.7 trillion through Shopify since the company began, and the platform powers businesses in over 175 countries. Shopify holds an estimated 14%+ of the US ecommerce market by GMV, second only to Amazon.
What it means for you: the platform is not a risk you need to worry about outgrowing or betting wrong on. The more useful read is competitive. GMV growing near 30% a year is the tide; if your store is growing slower than that, you are losing share on a rising platform, and the benchmarks below are where you find out why.
The average Shopify conversion rate
This is the number everyone wants, and it is also where the honesty note earns its keep, because there is no official Shopify conversion rate. Shopify does not publish one. Every figure you see is an estimate from an analytics provider measuring their own sample of stores, so the numbers differ, and anyone quoting a single precise figure as fact is overreaching.
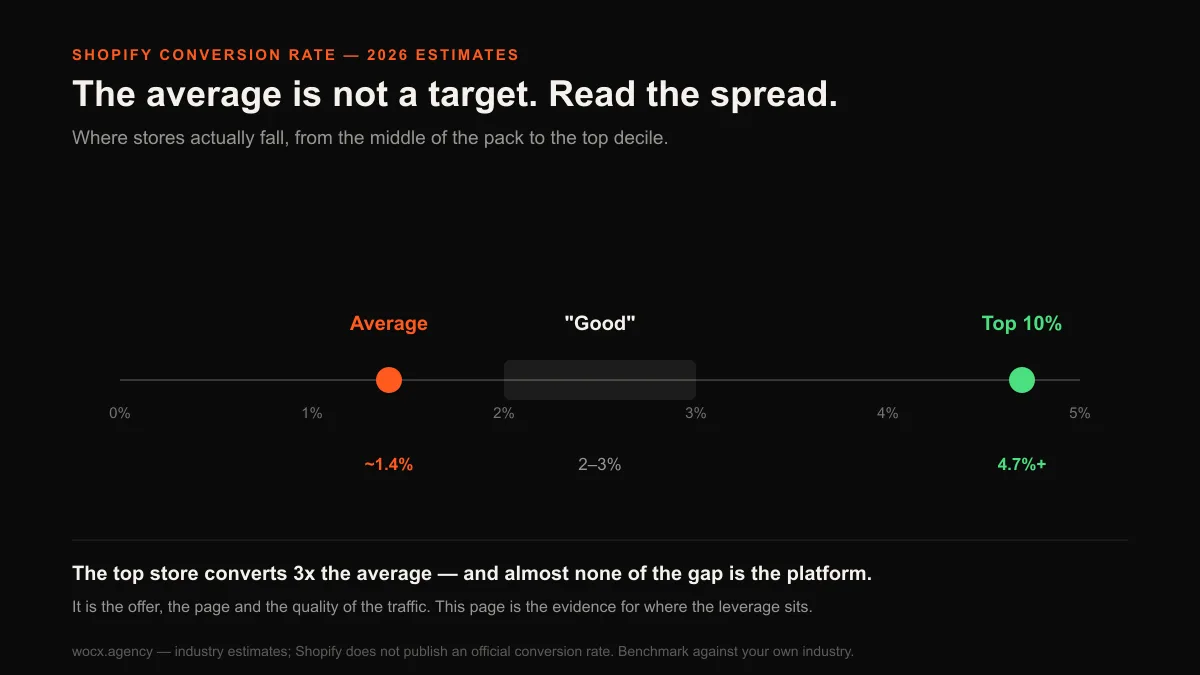
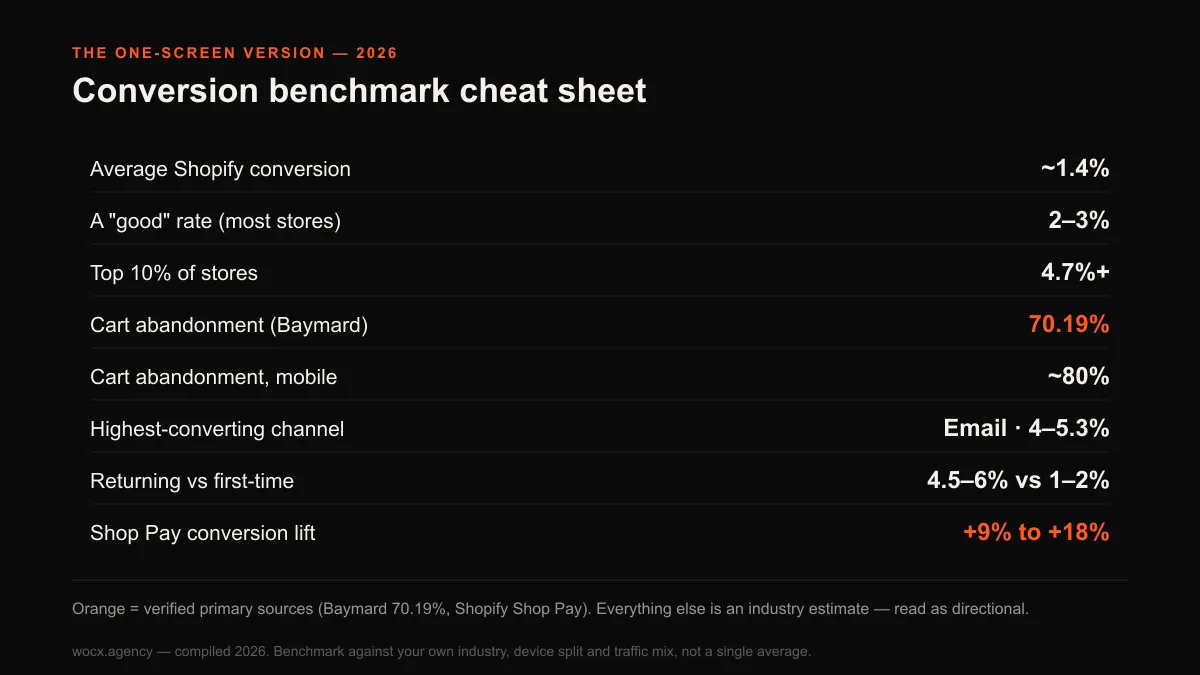
With that said, the estimates cluster. The commonly cited average Shopify conversion rate sits around 1.4%, with the top 20% of stores converting at roughly 3.2% or higher and the top 10% above 4.7%, per analytics providers such as those compiled in industry benchmarks. Read the spread, not the average. The gap between a typical store and a top-decile store is more than 3x, and almost none of it is the platform. It is the offer, the page, and the traffic quality.
What it means for you: if you take one thing from this page, take the spread. A 1.4% average is not a target, it is the middle of a very wide distribution, and the stores at the top are not running secret software. They are converting better traffic with a clearer offer. Do not benchmark against the average; benchmark against your own industry, below.
Conversion rate by industry
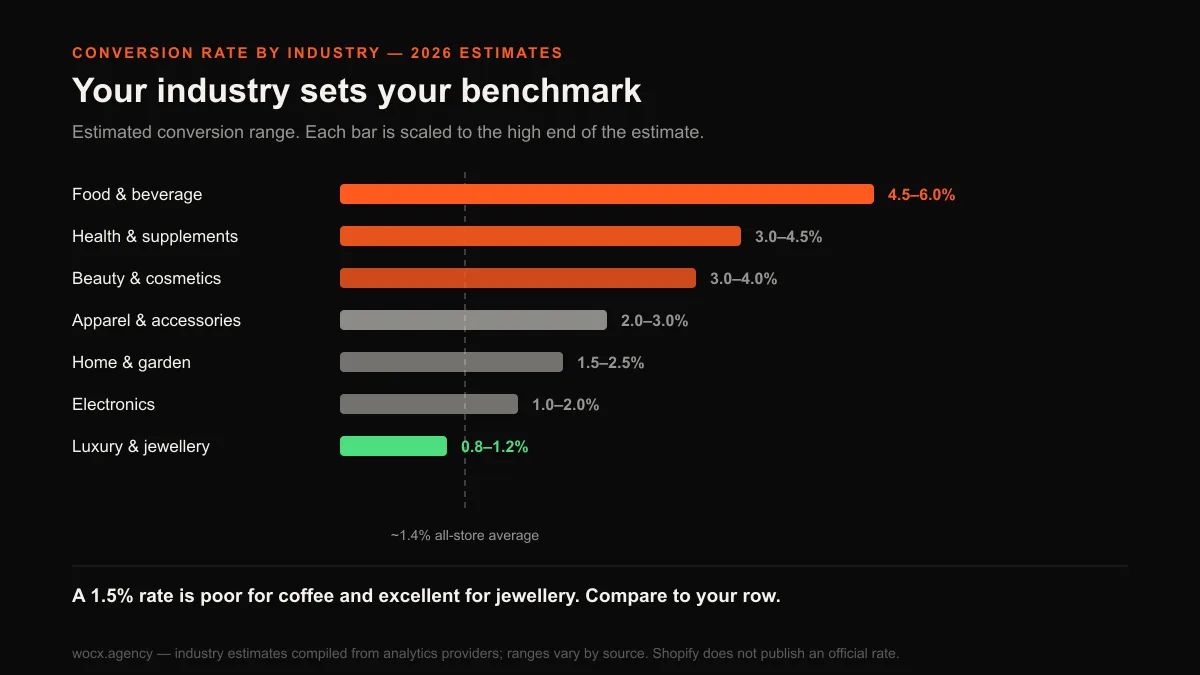
Industry is the single biggest driver of a conversion rate, which is why comparing your apparel store to a supplement brand tells you nothing useful. The pattern behind the numbers is simple once you see it: lower-priced, frequently repurchased products convert far higher than considered, high-ticket ones, because the decision is smaller and the shopper makes it more often. A bag of coffee is an easy, habitual yes; an engagement ring is a long, careful, once-in-a-decade no-until-it-is-a-yes. The following ranges are industry estimates and vary by source, so treat the exact figures as directional, but the ordering below is consistent across every provider that publishes this cut, which is what makes it trustworthy even when the precise percentages are not:
| Industry | Estimated conversion rate | Why |
|---|---|---|
| Food and beverage | 4.5–6.0% | Low price, habitual repurchase, little deliberation |
| Health and supplements | 3.0–4.5% | Subscription-friendly, repeat purchase |
| Beauty and cosmetics | 3.0–4.0% | Frequent replenishment, strong brand loyalty |
| Apparel and accessories | 2.0–3.0% | Fit and returns friction, but broad demand |
| Home and garden | 1.5–2.5% | Higher price, more consideration |
| Electronics | 1.0–2.0% | High ticket, heavy comparison shopping |
| Luxury and jewellery | 0.8–1.2% | Very high price, long deliberation, low frequency |
Use it like this: find your row before you judge your number. A 1.5% conversion rate is mediocre for a coffee brand and excellent for a jeweller. If you sell something considered and expensive, a “low” conversion rate is not a problem to panic about, it is the nature of the category, and your effort is better spent on average order value and lifetime value than on squeezing the rate.
Conversion by device: the mobile gap that will not close
Here is one of the most important and most ignored numbers in ecommerce. Despite a decade of “mobile-first” advice, mobile still converts far worse than desktop. Industry estimates put desktop conversion near 1.9% against mobile around 1.2%, a gap of roughly 60%. Some provider samples put it wider, at desktop 3.5% versus mobile 2.1%.
The cart data tells the same story from the other end. The average cart abandonment rate is 70.19%, from the Baymard Institute’s primary research, which makes it one of the reliable figures on this page rather than an estimate. The device split is more loosely sourced but widely reported and consistent: mobile abandonment runs about 80%, desktop about 66%, a gap that has barely moved in five years.
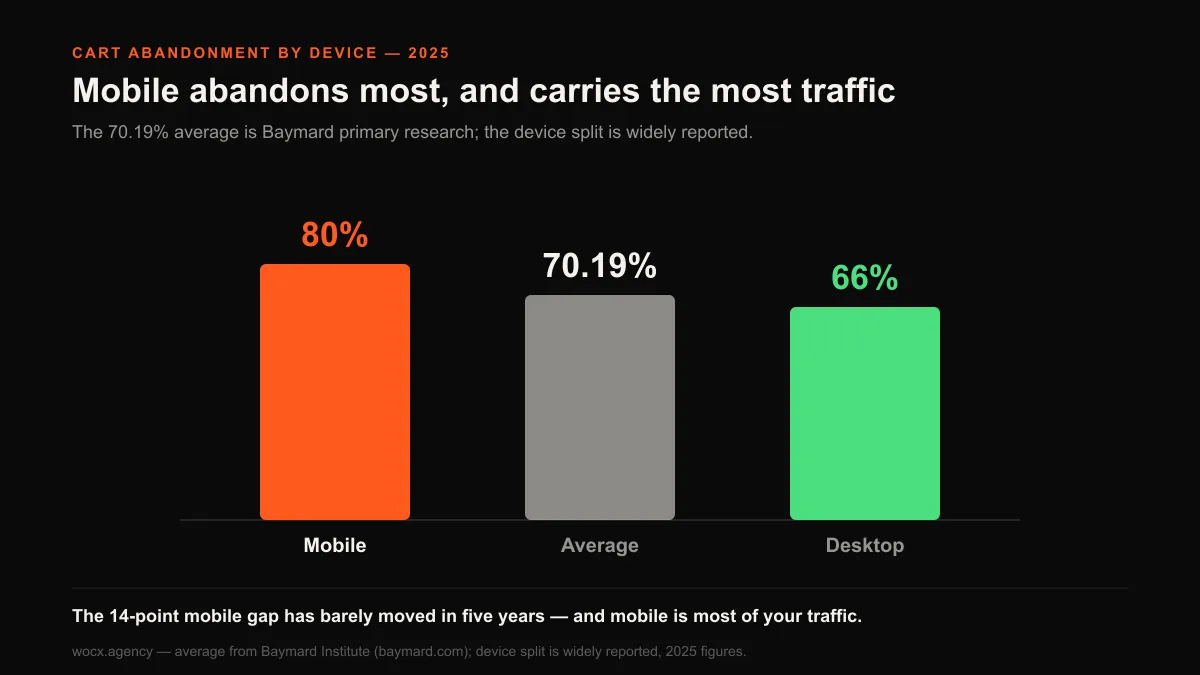
Why it matters: this is where the money is, because most of your traffic is mobile (more on that below) and it is converting at little more than half the desktop rate. A store that closes even a third of its mobile-to-desktop gap moves its overall number meaningfully. The usual causes are the ones you can fix: slow mobile load, fiddly forms, a checkout that fights a thumb, and a hidden shipping cost that surfaces too late. Your mobile checkout is almost certainly the highest-leverage surface in your whole store.
Where mobile actually sits
The reason the mobile gap matters so much is volume, because the device that converts worst is also the one carrying the most traffic, and that combination is the central tension of modern ecommerce. Mobile is now the majority of online shopping by sessions and, increasingly, by sales. Estimates put mobile commerce at roughly 59% of global ecommerce sales in 2025, though the figure is lower in the US at about 44.6%, per aggregated market data. The regional gap is worth noting before you take the global number as your own: a US-focused store lives closer to the 45% figure, while a store selling into mobile-first markets may be well past 60%. Either way, most of your visitors are arriving on the screen where you convert them least well.
Average order value tells a related story. Industry estimates put desktop AOV around $155 against roughly $112 on mobile. People browse and impulse-buy on their phones and place their larger, more considered orders on a desktop.
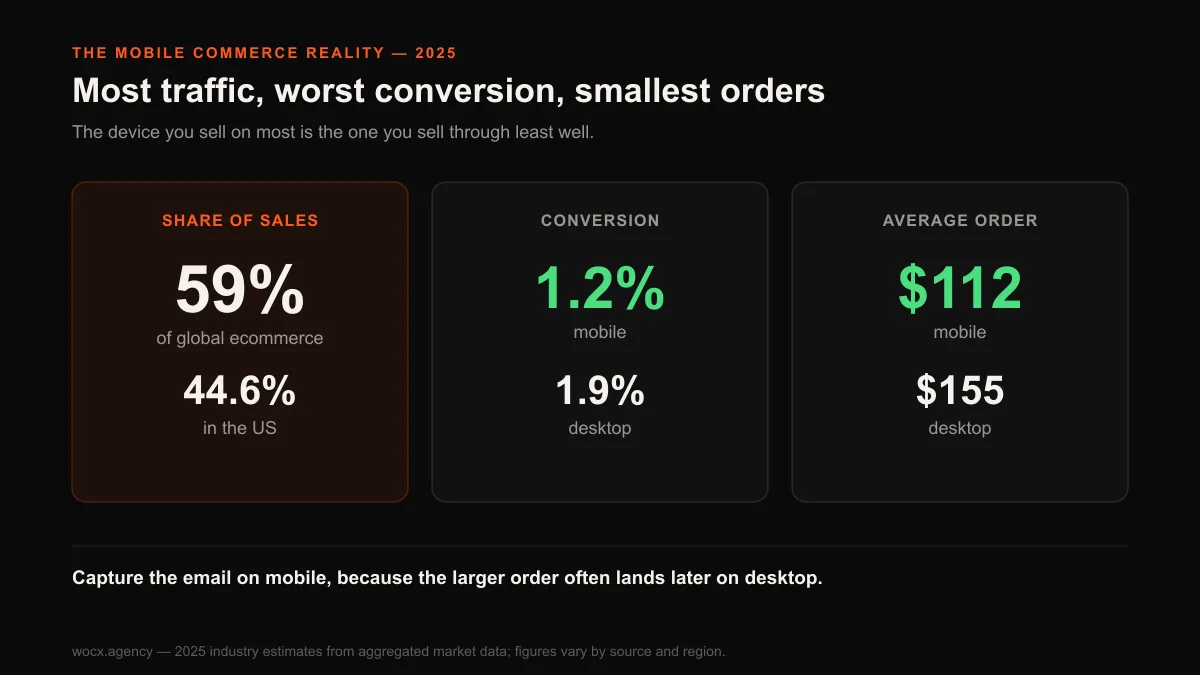
What it means for you: do not read “mobile converts worse” as “mobile matters less.” It carries the most sessions and it is where discovery happens. The right response is not to give up on mobile conversion but to treat the phone as the top of the funnel it has become: capture the email there so the visitor who browses on mobile and buys later on desktop is still yours.
The checkout: where the rate is won or lost
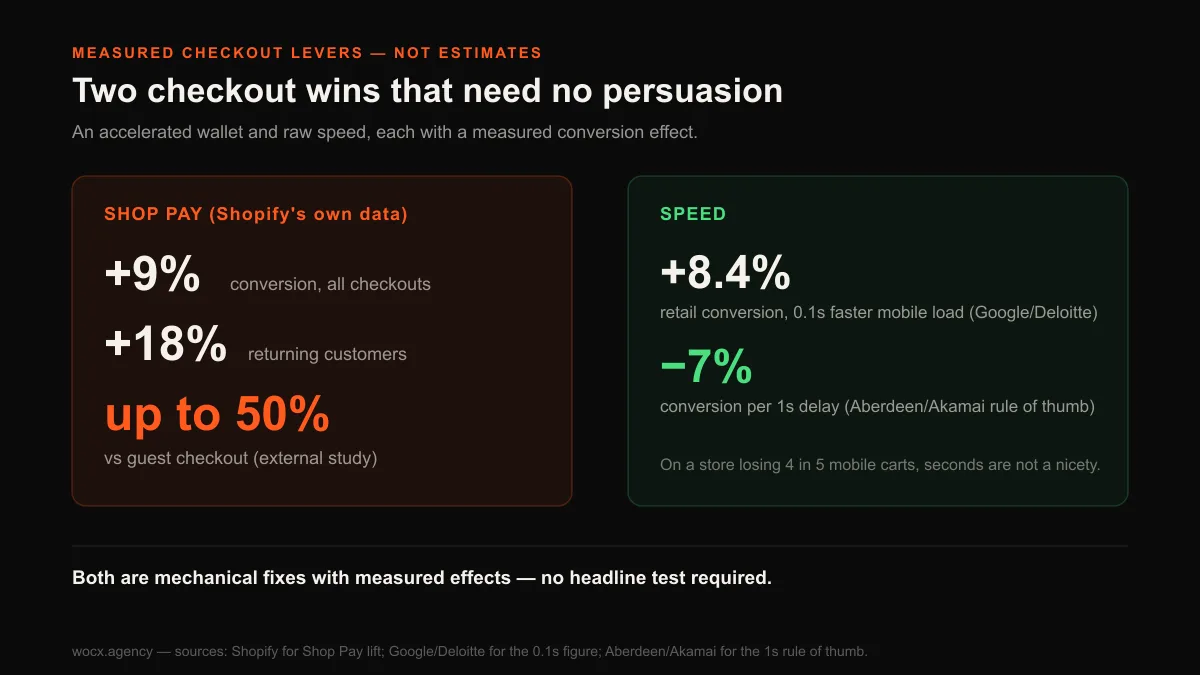
If cart abandonment is the biggest leak, the checkout is the pipe it leaks from, and this is one area where the numbers come from Shopify itself rather than a third-party estimate. Shopify reports that its accelerated wallet, Shop Pay, delivers an average 9% lift in conversion across all checkouts, rising to an 18% higher conversion rate for returning customers, per Shopify’s own data. An external study by a major global consulting firm put the lift as high as 50% relative to a standard guest checkout. The mechanism is partly speed: Shop Pay’s checkout completes in roughly a quarter of the time of a manual one, and every second of checkout friction correlates with more abandonment.
Speed matters before the checkout too, and the effect is large enough to treat as a conversion lever rather than a technical footnote. A Google and Deloitte study found that a mere 0.1-second improvement in mobile load time increased retail conversions by 8.4%. Separately, a widely cited rule of thumb, from earlier Aberdeen and Akamai research rather than that study, holds that every one-second delay cuts conversions by around 7%. On a store already losing four in five mobile carts, seconds are not a nicety.
What it means for you: the checkout is the highest-leverage surface you have, and two of the biggest wins there require no persuasion at all. Turning on an accelerated wallet and shaving load time off the path to purchase are mechanical fixes with measured, double-digit conversion effects. Before you test another headline, make sure the last few steps to payment are as fast and as few as they can be.
Conversion by traffic source
A conversion rate is close to meaningless without knowing where the traffic came from, because the source shapes the number more than almost anything on the page itself. The exact same store, with the exact same product and checkout, will post wildly different conversion rates across its channels, purely because the visitors arrive with different levels of intent and familiarity. A person who clicked a link in your own email already knows and trusts you; a person served an interruptive ad on social media has never heard of you and was not shopping. Judging the page by a number that blends the two together tells you almost nothing. Industry estimates put the ordering like this:
| Traffic source | Estimated conversion rate | Read |
|---|---|---|
| 4.0–5.3% | Warm, intent-rich, already yours | |
| Organic search | 2.7–3.0% | Active intent, searching for a solution |
| Direct | 2.5–3.0% | Knows the brand already |
| Referral | 2.0–2.5% | Borrowed trust from the referrer |
| Paid search | 1.5–2.5% | Intent, but colder and pricier |
| Paid social | 0.7–1.2% | Interruption, coldest traffic |
What it means for you: this is why a single site-wide conversion rate can mislead you badly. A store pouring budget into paid social will show a low blended rate that says nothing about the page and everything about the channel. Judge each channel against its own benchmark. And notice email at the top: the visitor you captured and emailed converts three to five times better than the cold paid-social click, which is the entire financial argument for building an email list.
New versus returning customers
The last cut is the one most stores underuse. Returning customers convert at an estimated 4.5–6.0%, against 1.0–2.0% for first-time visitors. A repeat buyer converts roughly three times better than a stranger, because the trust question is already answered.
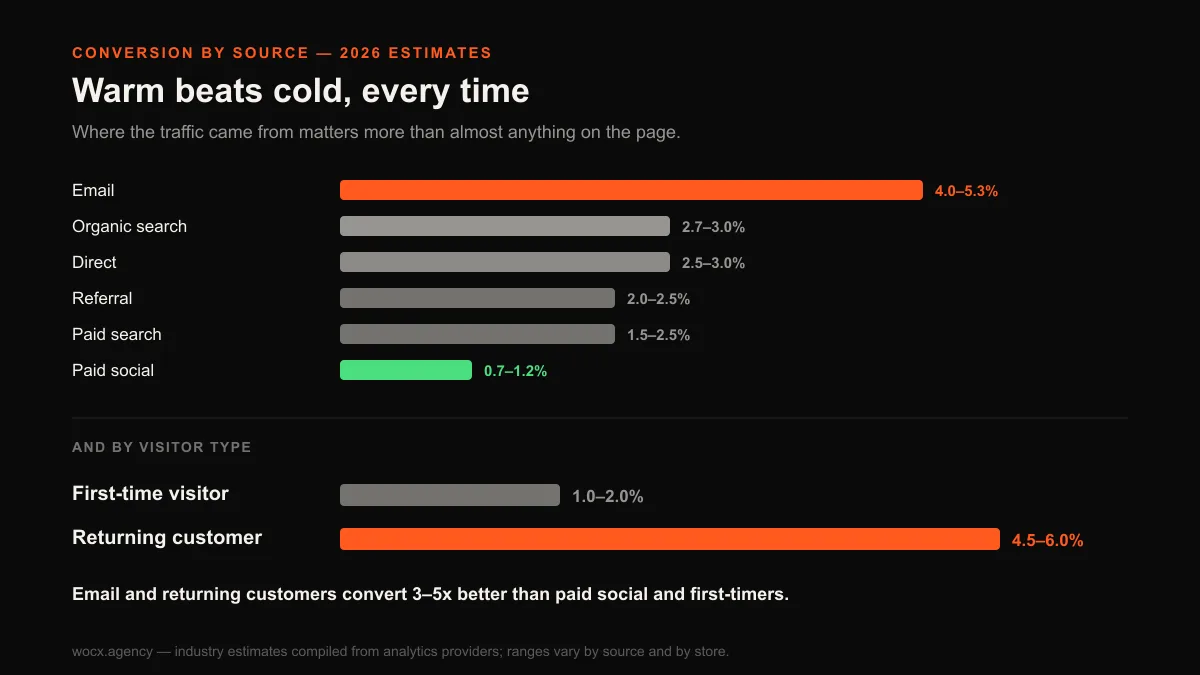
What it means for you: most conversion advice obsesses over the first-time visitor, who is the hardest and most expensive person to convert. The cheaper win is the machinery that turns a first order into a second: the post-purchase email, the reason to come back, the retention work that quietly lifts your blended rate by growing the high-converting returning segment. It is less glamorous than a homepage redesign and usually worth more.
The number that matters more than conversion rate
Here is the uncomfortable truth that sits underneath every statistic on this page: conversion rate on its own is a vanity metric, and optimising it in isolation can actively lose you money. Revenue is not conversion rate. Revenue is traffic multiplied by conversion rate multiplied by average order value, and then multiplied again, over time, by how often a customer comes back. A store can lift its conversion rate by leading with a deep discount and end up poorer, because it traded margin and average order value for a bigger percentage. Another can watch its conversion rate fall as it moves upmarket, while revenue climbs because the orders got larger and the customers more loyal.
This is why the industry benchmarks above are a starting point and not a destination. A jeweller converting at 1% with a $900 average order and a 40% repeat rate is running a far healthier business than a gadget store converting at 3% with a $30 order and no second purchase. The conversion rate comparison would tell you the gadget store is winning. The bank balance would tell you the opposite. Any serious read of your own numbers has to hold conversion rate, average order value and repeat-purchase rate in the same frame, because moving one at the expense of the others is the most common way a store optimises itself into trouble.
What it means for you: before you chase the conversion benchmark for your industry, decide which of the three levers is actually your constraint. If your traffic is warm and your orders are large but few people come back, your problem is retention, not conversion. If your orders are tiny, your problem is average order value. Pouring effort into conversion when the real leak is elsewhere is how stores stay busy and stay flat.
How to actually use these numbers
A benchmark is a diagnostic tool, not a scoreboard, and misusing one is worse than not having it. Three rules make these statistics useful instead of misleading.
First, compare like with like. Your number only means something against your own industry, your own device split, and your own traffic mix. A blended site-wide rate compared to a generic “average” tells you almost nothing.
Second, trust the source hierarchy. Shopify’s GMV and Baymard’s abandonment rates are measured and verifiable. The conversion benchmarks are estimates that move with whoever measured them, so use them for direction, not for a precise target you beat yourself up over.
Third, act on the widest gaps. The mobile-versus-desktop gap and the paid-versus-email gap are the two largest and most consistent in all of this data, which means they are where the leverage is. Fixing your mobile checkout and shifting spend toward owned channels will move your number more than any amount of button-colour testing.
There is a fourth rule worth stating on its own, because it is the one that quietly wastes the most effort: do not chase a benchmark you have not earned the traffic for. A conversion rate is a ratio, and a ratio can be lifted from either side. A store that doubles its rate by cutting its worst-performing paid traffic has not built a better store; it has built a smaller one that looks more efficient. The number went up and the revenue went down. This is why a conversion rate should always be read next to total orders, not on its own. The goal is more orders at a healthy margin, and a rising conversion rate is only good news when it is not bought by shrinking the top of the funnel or the size of the basket.
Put together, the numbers on this page argue for a specific order of operations. Fix the mechanical leaks first, because they are measured and certain: the mobile checkout, the load time, the accelerated wallet. Then answer the objection that abandons the most carts, which is almost always shipping cost surfacing too late. Only then reach for the softer levers, the copy and the layout and the proof, and test them against your own baseline rather than a benchmark from a store you cannot see inside. The statistics are a map of where the leverage tends to sit; your own analytics are the territory.
If you want to know what a good conversion rate is for your specific store and how to improve it, that guide walks through the levers in order. This page is the evidence underneath it.
FAQ
What is the average Shopify conversion rate in 2026?
There is no official figure, because Shopify does not publish one. Industry estimates from analytics providers put the average around 1.4%, with the top 20% of stores at roughly 3.2% or higher and the top 10% above 4.7%. Treat these as directional, and benchmark against your own industry rather than the average.
What is a good conversion rate for a Shopify store?
It depends almost entirely on your industry and traffic. Food and beverage stores commonly see 4.5–6%, apparel 2–3%, and luxury or jewellery under 1.2%. A rate that is excellent in one category is poor in another, so compare your number to your industry’s range, not to a single universal target.
Why does mobile convert worse than desktop?
Mobile conversion runs well below desktop (industry estimates put it around 1.2% versus 1.9%), and Baymard’s data shows mobile cart abandonment near 80% against roughly 66% on desktop. The causes are practical: slower load, harder form entry on a small screen, and checkout friction. Because mobile carries the majority of traffic, this gap is usually a store’s biggest opportunity.
How reliable are these Shopify statistics?
It varies, which is why we label sources. Shopify’s GMV and revenue come from audited SEC filings and are reliable. Cart abandonment comes from the Baymard Institute’s research and is reliable. The conversion-rate benchmarks are industry estimates that differ by provider, so we present them as ranges and recommend using them for direction rather than as precise facts.
What is the ecommerce cart abandonment rate?
The Baymard Institute puts the average shopping cart abandonment rate at 70.19%, based on an analysis of multiple studies. It splits sharply by device, at roughly 80% on mobile and 66% on desktop.
Does Shop Pay actually improve conversion?
Yes, and this is one of the few figures that comes from Shopify itself rather than an estimate. Shopify reports Shop Pay delivering an average 9% lift in conversion across all checkouts, rising to 18% for returning customers, and an external study put the lift as high as 50% versus a standard guest checkout. Part of the effect is speed: Shop Pay’s checkout completes in roughly a quarter of the time of a manual one, and checkout speed correlates directly with completion.
Which traffic source converts best on Shopify?
Email, by a wide margin. Industry estimates put email conversion at 4.0–5.3%, against 2.7–3.0% for organic search and just 0.7–1.2% for paid social. The pattern is about intent and familiarity: the warmer and more owned the channel, the better it converts. It is the clearest financial argument there is for building and using an email list rather than renting cold traffic.
Want to know how your own store’s conversion compares to these benchmarks, by device and traffic source? Send me your store and I will measure it against the numbers above and show you which gap is costing you the most. Free, and usually a reply within the hour.