/Conversion optimisation
Average order value: what it is, and the honest way to raise it
August 14, 2026 · WOCX
Average order value is the amount a customer spends in a single order, on average, and it is the cheapest number in your whole business to move. Every other growth lever asks you to buy more traffic or convert more of it; raising average order value earns more from the visitors you already have and already paid for. This page explains what the number is, how to calculate it, what actually counts as a good figure, and the measured ways to raise it, honestly, without pretending there is a magic percentage waiting for you.
The honesty rule that runs through everything we publish applies here too. There is no universal “good” average order value, and anyone who quotes one without asking what you sell is guessing. A jewellery store and a phone-case store can both be healthy with figures that are ten times apart. So this is less about a target to hit and more about understanding the number, watching your own trend, and pulling the specific levers that raise it.
What average order value actually means
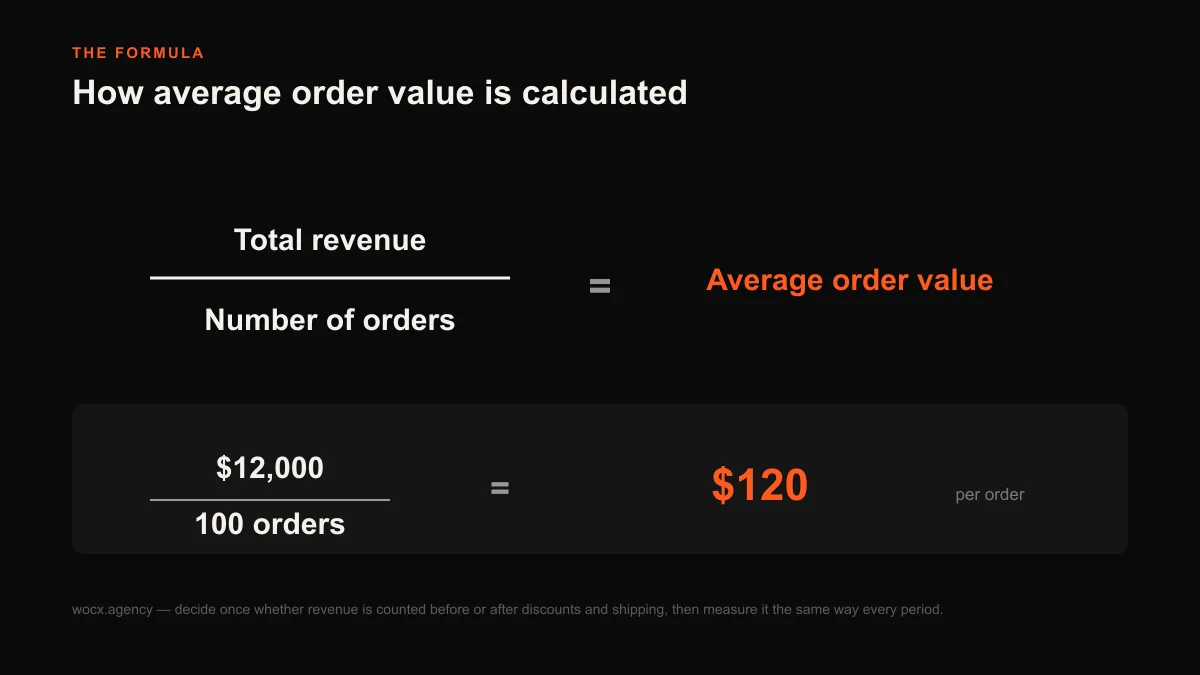
Average order value, usually shortened to AOV, is the mean amount spent per order over a period you choose. If 100 orders came through last month and they totalled $12,000, your average order value was $120. That is the whole definition. It is not revenue, it is not profit, and it is not what any single customer spends over their lifetime; it is simply the typical size of one checkout.
It matters because it sits in the middle of the only equation that describes a store’s revenue: traffic, multiplied by conversion rate, multiplied by average order value. Most founders spend almost all of their energy on the first two, buying more visitors and trying to convert more of them, and almost none on the third, even though the third is the one you can move without spending a cent on ads or waiting months for SEO. A store that lifts its average order value by 15% has effectively given itself 15% more revenue from the exact same traffic, and it keeps that lift on every future order.
How to calculate average order value
The formula is deliberately simple: total revenue divided by number of orders, over the same window. Take a month, a quarter, or a rolling ninety days, add up the revenue from every order, divide by how many orders there were, and that is your average order value for that window. Shopify calculates it for you in the analytics dashboard, but doing it by hand once is worth it because it forces two useful decisions. First, decide whether you count revenue before or after discounts and shipping, and then stay consistent, because switching mid-year makes your trend meaningless. Second, decide your window and keep it fixed, because a figure measured over a launch week and a figure measured over a quiet month are not comparable. The number itself is easy; the discipline is in measuring it the same way every time so the trend tells the truth.
What counts as a good average order value
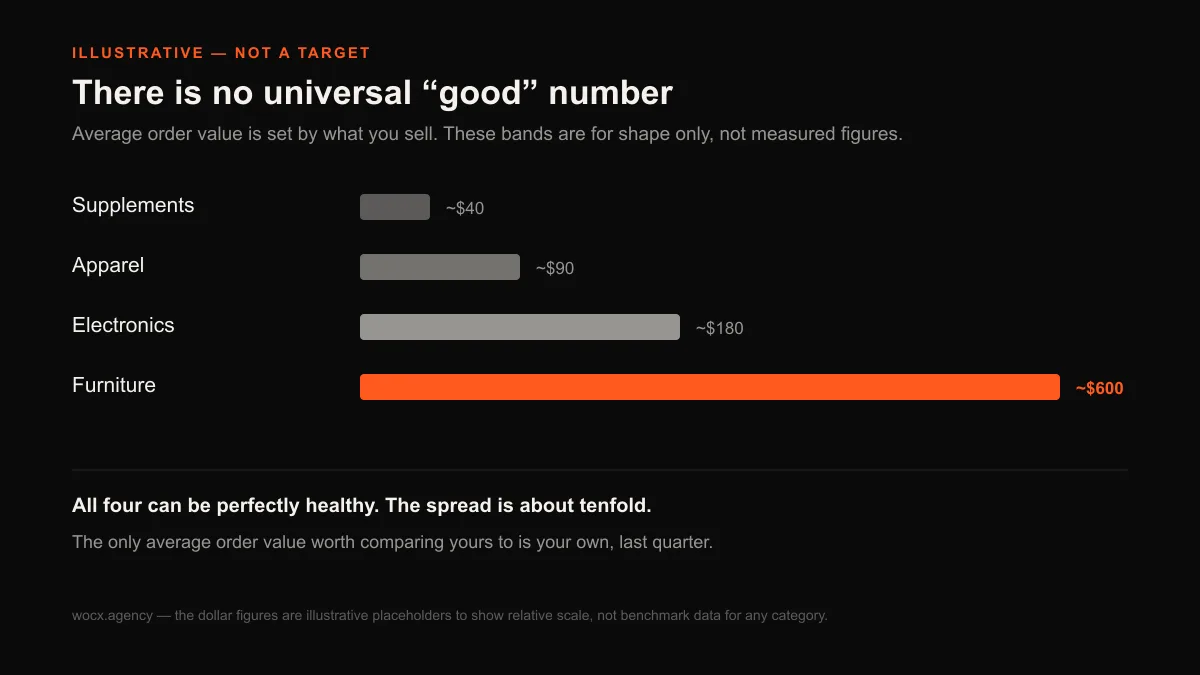
This is where most articles quietly mislead you. They print a single figure, or an “industry average”, and imply you should be near it. The truth is that average order value is almost entirely a function of what you sell and how you price it, so a cross-industry average is close to meaningless for any individual store. A supplements brand selling a $30 tub and a furniture brand selling a $900 sofa are both perfectly healthy at wildly different numbers, and comparing either to a blended average tells you nothing you can act on.
The honest version is this: the only average order value worth comparing yours to is your own, last quarter. A number that is climbing means your merchandising, offers and pricing are working together; a number that is flat or falling while your traffic grows usually means you are acquiring more price-sensitive buyers or leaning too hard on your cheapest product. Benchmarks by category exist and can give you a rough sense of the neighbourhood, but treat them the way you would treat someone else’s salary: mildly interesting context, and a terrible target. Your competitor’s average order value depends on their catalogue, their customer, and their discounting, none of which you can see, so chasing their number is chasing a shadow.
Why the number matters more than most stores think
The reason average order value deserves real attention is that it quietly decides whether your paid acquisition is viable at all. If it costs you $30 to acquire a customer and your average order is $40, you are running on fumes after product cost. Lift that average order to $60 and the same $30 acquisition cost suddenly looks comfortable, which means you can afford to bid more, reach more people, and outspend competitors who never fixed their basket. Average order value is the number that sets your ceiling on ad spend, and most stores that feel “stuck” on paid traffic do not have a traffic problem, they have a basket problem.
It compounds the other way too. Because raising average order value costs you nothing per order once the mechanism is built, the extra margin flows almost entirely to the bottom line. A higher conversion rate brings in more orders at the same basket size; a higher average order value grows every order you were already going to get, including the ones from your best, most loyal customers. That is why, on a store with steady traffic, it is often the single most profitable lever available, and it is the one this studio reaches for first when the ad account has no more room to give.
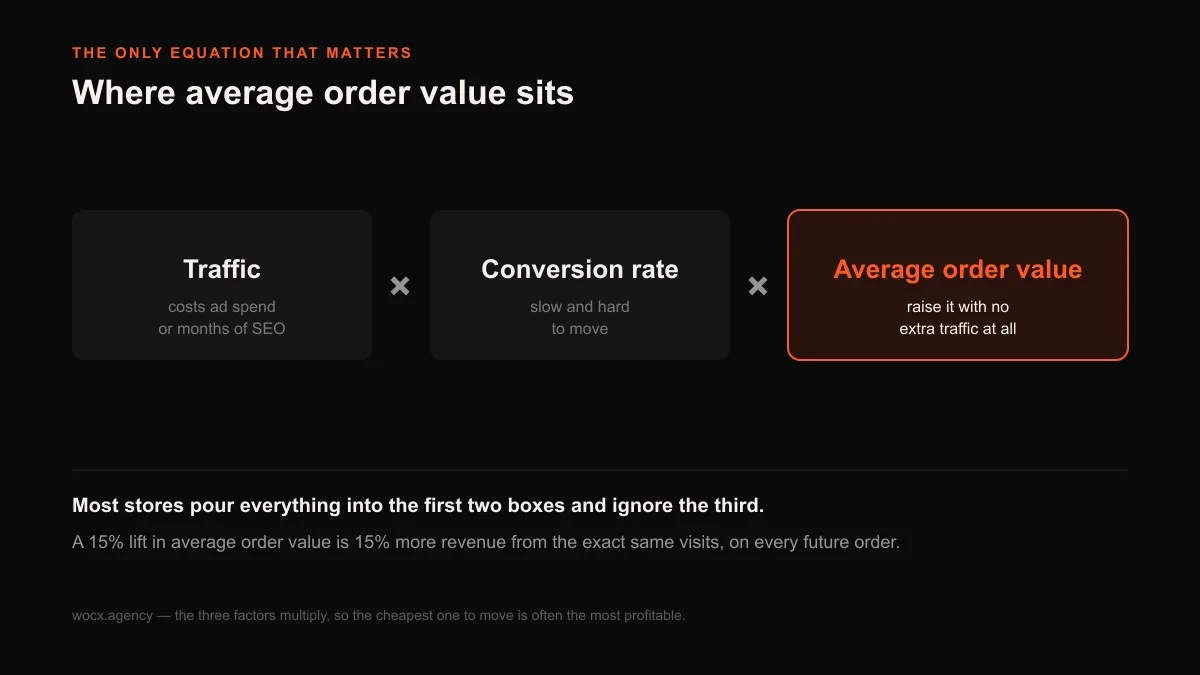
This is also why conversion rate and average order value belong on the same dashboard. They are two of the three levers in that equation, and a store that only ever watches conversion is optimising half of what it could. The stores that grow the most reliably are the ones that treat the basket as seriously as the checkout, because the two compound: a better checkout brings more orders, and a bigger basket grows all of them at once.
The measured ways to raise average order value
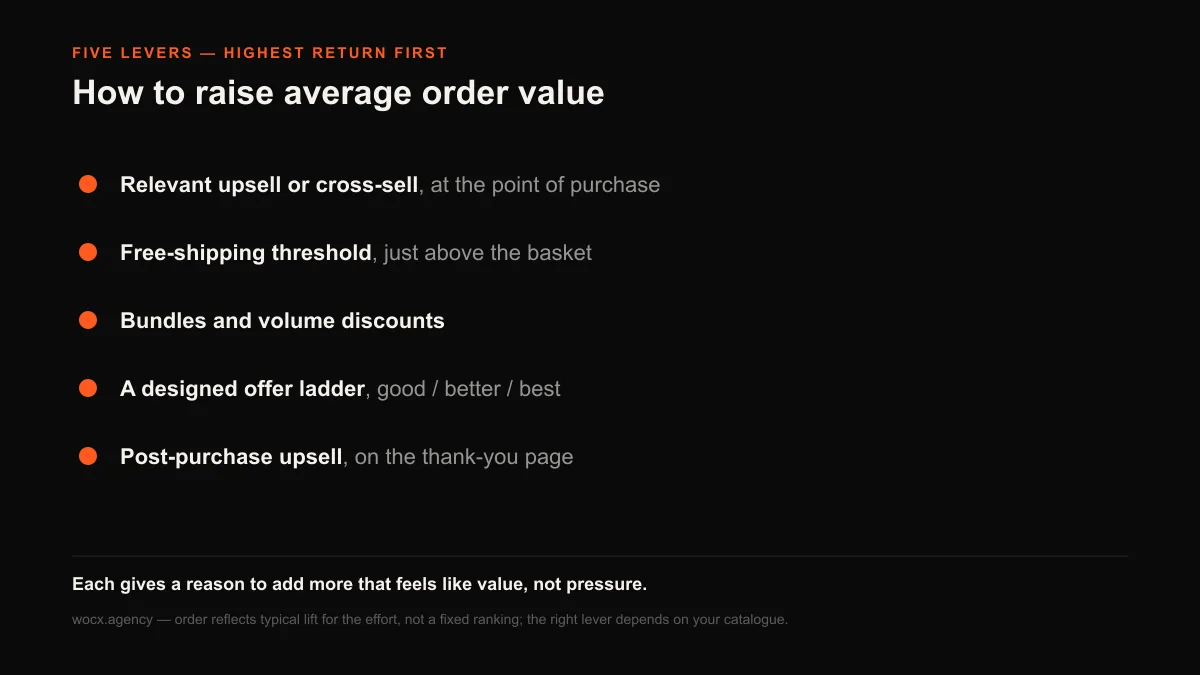
The levers that move average order value are well understood, and they share one trait: each one gives the customer a reason to add more that feels like value, not pressure. Here are the ones that consistently work, in rough order of how much lift they tend to return for the effort.
| Lever | How it lifts the basket | Effort to install |
|---|---|---|
| Upsell / cross-sell | Adds a relevant item at the point of purchase | Low to medium |
| Free-shipping threshold | Gives a concrete reason to add one more item | Low |
| Bundles & volume discounts | Makes the bigger purchase the smarter one | Medium |
| Offer ladder (good/better/best) | Nudges shoppers to higher tiers | Medium |
| Post-purchase upsell | One-click add after payment, zero checkout risk | Low to medium |
Offer the right thing at the right moment. The highest-return lever is a relevant upsell or cross-sell shown when the customer is already committed, on the product page or in the cart. The word “relevant” is doing the heavy lifting: a phone case offered with a phone converts, a random bestseller bolted onto every cart does not. A good cross-sell reads as helpful, because it completes the thing the customer is already buying.
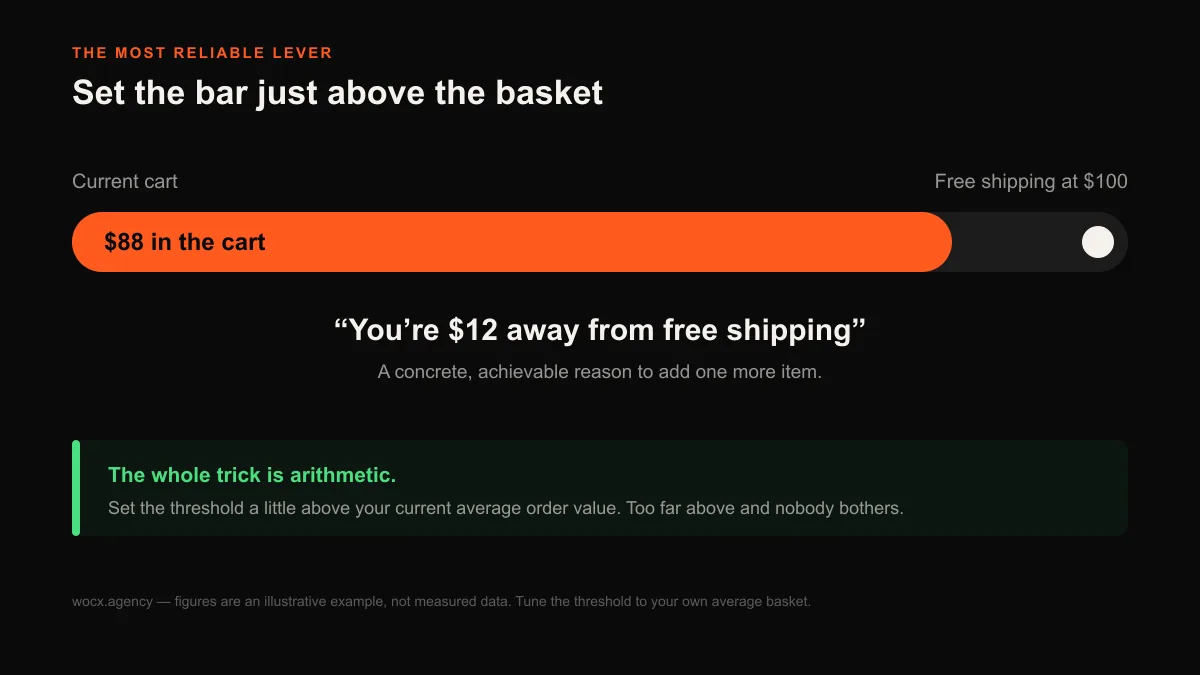
Set a free-shipping threshold just above your current basket. A free-shipping bar that says “you’re twelve dollars away from free shipping” is one of the most reliable AOV levers there is, because it hands the customer a concrete, achievable reason to add one more item. The trick is arithmetic: set the threshold a little above your current average order value, not so far above it that nobody bothers. Set it too high and it demotivates; set it just out of reach and it pulls the basket up.
Bundle things that belong together, and price the bundle to reward it. A bundle or a bulk discount raises average order value by making the bigger purchase the obviously smarter one. “Buy two, save fifteen percent” works because it turns a single-unit shopper into a multi-unit one without feeling like a hard sell, and it is especially strong for consumables people will rebuy anyway.
Design the whole offer, not just the discount. How you architect tiers, gifts and thresholds together, your offer architecture, often matters more than the size of any single discount. A well-built ladder of “good, better, best” nudges more customers to the middle and top options than a flat catalogue ever will, and it does it without cheapening the brand.
Add a genuine post-purchase upsell. The moment right after someone buys, on the thank-you page, is the highest-intent moment you will ever get, and a one-click add there carries no checkout friction because the payment is already done. It is found money on orders you have already won, and it never risks the original conversion because it happens after it.
How to track it so the number stays honest
Raising average order value is only real if you can see it move, and that means watching the trend, not a single snapshot. Pick your window, ninety days rolling is a good default, and look at the direction rather than the day-to-day noise. Segment it where you can: your average order value from email is almost always higher than from paid social, because the audience is warmer, and knowing that gap tells you where your basket-building offers are landing and where they are being wasted on bargain-hunters.
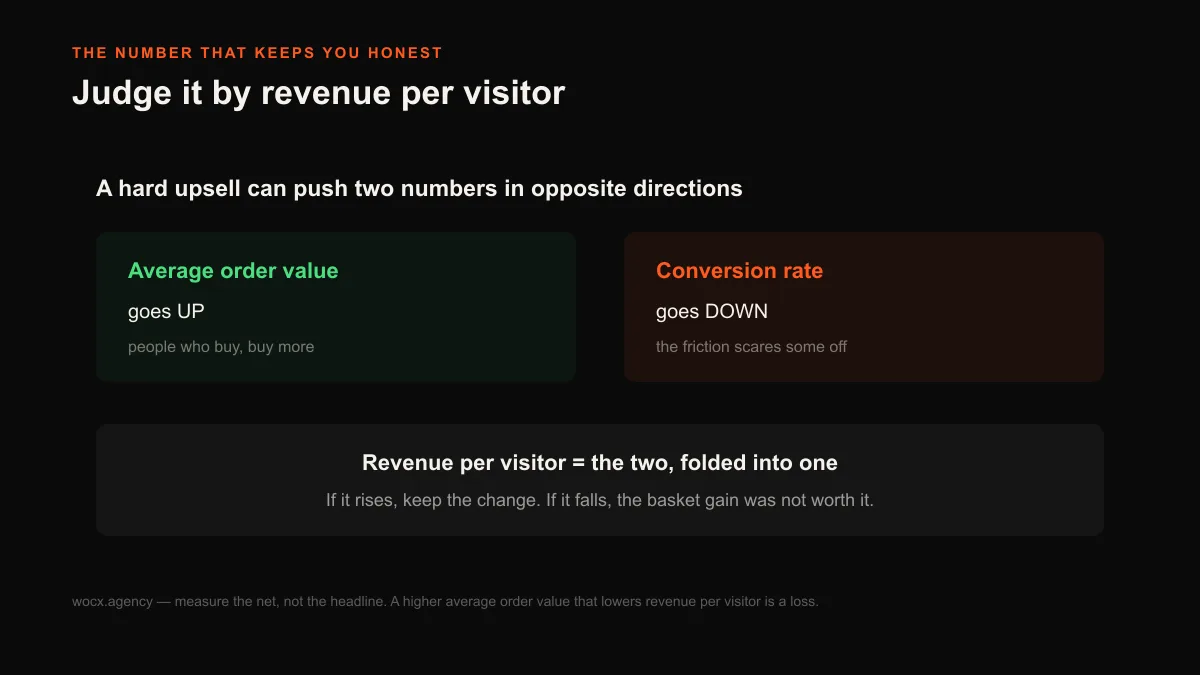
Watch it alongside conversion rate, not instead of it, because the two can trade against each other. A hard upsell that lifts average order value but quietly drops your conversion rate can leave you worse off overall, so the honest scoreboard is revenue per visitor, which folds both numbers into one. If a change raises average order value without denting conversion, keep it. If it lifts the basket but fewer people check out, measure the net before you celebrate. That single discipline, judging basket-building changes by revenue per visitor rather than average order value alone, is what separates a real gain from a vanity one.
What to actually do this week
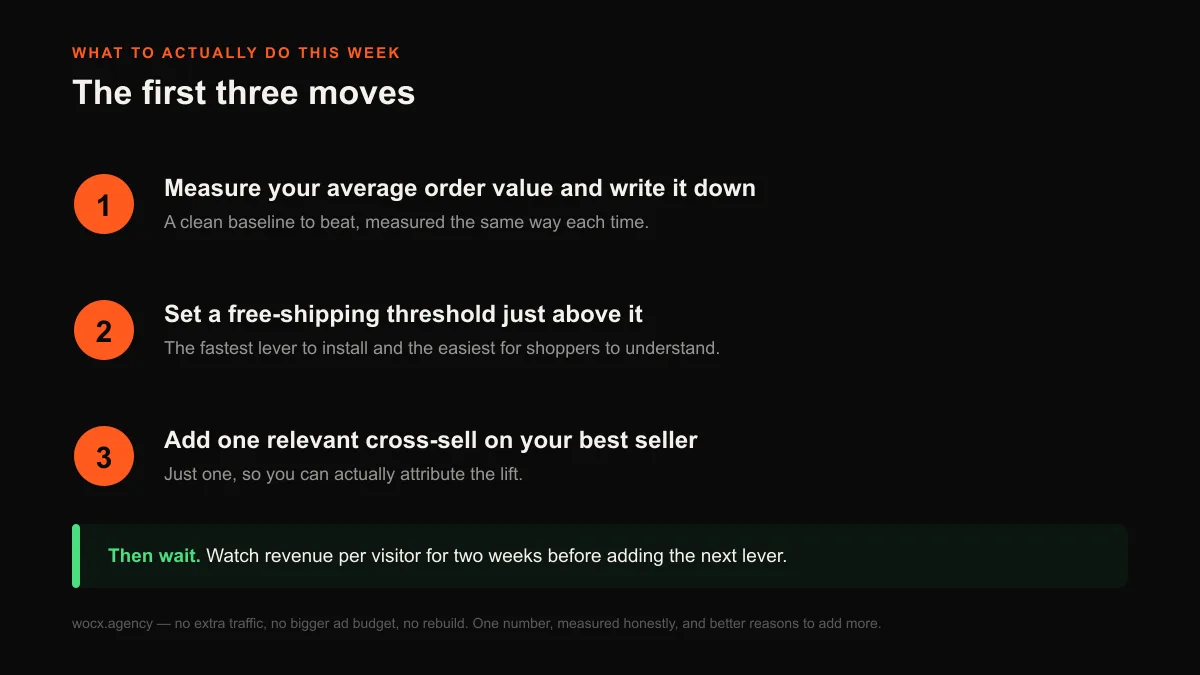
If you want the number to move, the order of operations is clear. First, measure your current average order value cleanly and write it down, so you have a baseline to beat. Second, set a free-shipping threshold a little above that number, because it is the fastest lever to install and the easiest for customers to understand. Third, add one relevant cross-sell on your best-selling product’s page, not everywhere at once, so you can actually attribute the lift. Then watch revenue per visitor for two weeks before you add the next lever.
None of this requires more traffic, a bigger ad budget, or a rebuild. It requires understanding one number, measuring it the same way every time, and giving customers honest reasons to add a little more to a basket they already wanted. That is the quiet difference between a store that grows only when it spends more, and one that grows more from every visit it already earns.
Average order value versus lifetime value
Average order value is often confused with customer lifetime value, and keeping them straight changes how you act. Average order value measures a single order; lifetime value measures the whole relationship, every order a customer places over the time they stay with you. A store can have a modest average order value and an excellent lifetime value if customers come back often, which is exactly the pattern for consumables and subscriptions. The two are related but not interchangeable, and they pull on different levers: average order value is moved by what happens inside one checkout, while lifetime value is moved by retention, repeat purchase and how well you bring people back.
The useful link between them is that raising average order value usually raises lifetime value as a side effect, because a customer who spends more per order tends to be worth more over time, all else equal. But the reverse is not guaranteed, and optimising one at the expense of the other is a real risk: a heavy-handed upsell that lifts today’s basket but sours the experience can quietly cost you the second and third orders that matter far more. Watch both, and let lifetime value be the tie-breaker when a basket-building tactic feels pushy.
| Metric | What it measures | Do not confuse it with |
|---|---|---|
| Average order value | Spend in one order, on average | Revenue, which is orders times this |
| Conversion rate | Share of visitors who buy | Basket size, which is separate |
| Customer lifetime value | Total spend across the whole relationship | A single order’s value |
| Revenue per visitor | Value of the average visit | Any one metric alone |
The mistakes that quietly lower it
Most stores that struggle with average order value are not missing a tactic; they are running one badly. The most common mistake is over-discounting, where a store trains its customers to wait for the next sale and shrinks every basket in the process, because a shopper who expects twenty percent off will build a smaller cart at full price. The second is bolting an irrelevant upsell onto every product, which readers learn to ignore within a visit or two, so the one place a relevant cross-sell would have worked gets tuned out along with the noise. The third is setting the free-shipping threshold far above the current basket, where it demotivates instead of nudging, because a shopper eighty dollars away from free shipping simply gives up on it.
The quieter mistake is a merchandising one: leading every visitor to the cheapest product. It feels like a good way to convert, and it does lift conversion, but it anchors the whole store low and drags the average down with it. The fix is not to hide the entry-level item but to make the better option easy to find and easy to justify, so the shopper who was ready to spend more is never quietly pushed toward spending less. None of these mistakes look dramatic on any single order, which is exactly why they persist; they only show up in the trend, which is one more reason to watch it.
Average order value on mobile versus desktop
One split worth watching is device. Mobile now drives the majority of Shopify store traffic, often 70% or more of sessions, yet mobile average order value is almost always lower than desktop, because a small screen makes browsing, comparing and adding a second item genuinely harder. That gap is not a fixed law of nature; it is a design problem wearing a data disguise. A mobile basket running 20 to 30% below desktop usually points to friction the desktop layout hides: an add-to-cart that takes too many taps, a cross-sell that sits invisible below the fold, or a free-shipping bar that never renders on a phone.
Because most of your orders now come from a phone, closing even part of that gap moves your blended average order value more than almost any desktop tweak. The practical step is to check your average order value by device before you assume the number is a merchandising problem, since a large mobile-to-desktop gap points you somewhere specific. Our mobile conversion guide covers the layout side in depth; for average order value in particular the rule is simple, measure the two separately and treat a wide gap as a fixable design gap, not a permanent trait of your store.
FAQ
What is average order value?
Average order value is the mean amount a customer spends in a single order over a chosen period. You calculate it by dividing total revenue by the number of orders in that window. It measures the typical size of one checkout, and it is distinct from revenue, profit, and customer lifetime value, which measure different things.
How do you calculate average order value?
Divide total revenue by the total number of orders over the same time period. If a store made twelve thousand dollars across one hundred orders in a month, its average order value was one hundred and twenty dollars. Decide once whether you count revenue before or after discounts and shipping, then measure it the same way every period so the trend stays comparable.
What is a good average order value for a Shopify store?
There is no universal good number, because average order value depends almost entirely on what you sell and how you price it; a supplements store and a furniture store can both be healthy with figures ten times apart. The only meaningful comparison is to your own average order value last quarter. A figure that climbs over time is the real sign of health, not proximity to a cross-industry average.
How can I increase average order value?
The measured levers are relevant upsells and cross-sells shown at the point of purchase, a free-shipping threshold set just above your current basket, bundles and volume discounts, a well-designed offer ladder, and a post-purchase upsell on the thank-you page. Each works by giving the customer a reason to add more that feels like value. Judge every change by revenue per visitor so a basket gain that hurts conversion does not slip through.
Why does average order value matter?
Because it sets the ceiling on what you can afford to spend acquiring a customer, and because raising it costs almost nothing per order once the mechanism is built, so the extra margin flows straight to profit. It is often the most profitable growth lever on a store with steady traffic, since it grows every order you were already going to get.
Want to know which lever would move your store’s average order value the most, and by roughly how much? Send me your store and I will look at your basket, your offers and your product pages and tell you where the fastest lift is. Free, and usually a reply within the hour.